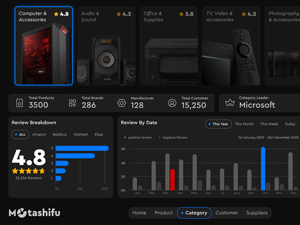
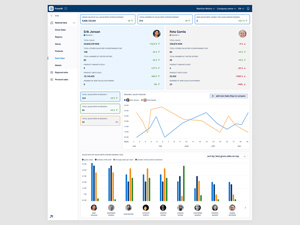
Here’s a well-designed dashboard for PowerBI that enables users to effectively analyze and visualize complex data sets with ease, providing valuable insights through interactive charts, graphs and key performance indicators (KPIs).
Subscribe to our big freebie newsletter
Receive an awesome list of free handy resources in your inbox every week!